Using RSI for Identifying Market Momentum
Relative Strength Index (RSI) is a popular technical indicator used by traders to identify overbought or oversold conditions in the market. However, RSI can also be used to gauge market momentum and predict potential trend reversals. In this article, we will explore how to use RSI for identifying market momentum.
Understanding RSI
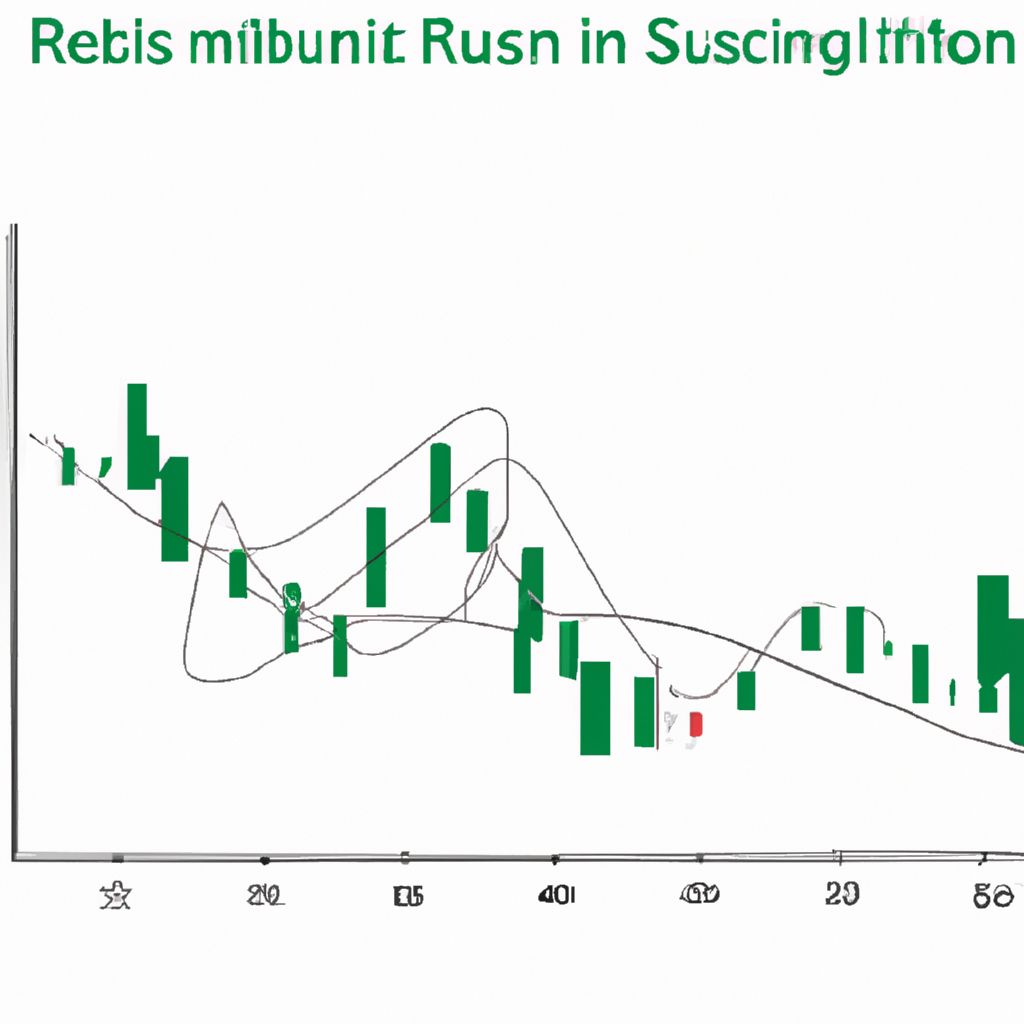
RSI is a momentum oscillator that measures the speed and change of price movements. It ranges from 0 to 100 and is typically used on a 14-day timeframe. A reading above 70 indicates that a security is overbought, while a reading below 30 indicates that it is oversold.
Using RSI for Market Momentum
When using RSI for identifying market momentum, traders look for divergences between RSI and price movements. A bullish divergence occurs when RSI makes a higher low while prices make a lower low, indicating potential upward momentum. Conversely, a bearish divergence occurs when RSI makes a lower high while prices make a higher high, indicating potential downward momentum.
Confirming Trends with RSI
Traders can also use RSI to confirm trends in the market. When prices are trending higher, RSI should also be trending higher to confirm the strength of the uptrend. Conversely, when prices are trending lower, RSI should also be trending lower to confirm the strength of the downtrend.
Identifying Overbought and Oversold Conditions
While RSI is primarily used to identify overbought or oversold conditions, it can also be used to gauge market momentum. When RSI reaches extreme levels above 70 or below 30, it can indicate that a security is overextended and due for a reversal in momentum.
Conclusion
RSI is a versatile technical indicator that can be used to identify market momentum and predict potential trend reversals. By understanding how to interpret divergences, confirm trends, and identify overbought or oversold conditions, traders can effectively use RSI to make more informed trading decisions.


