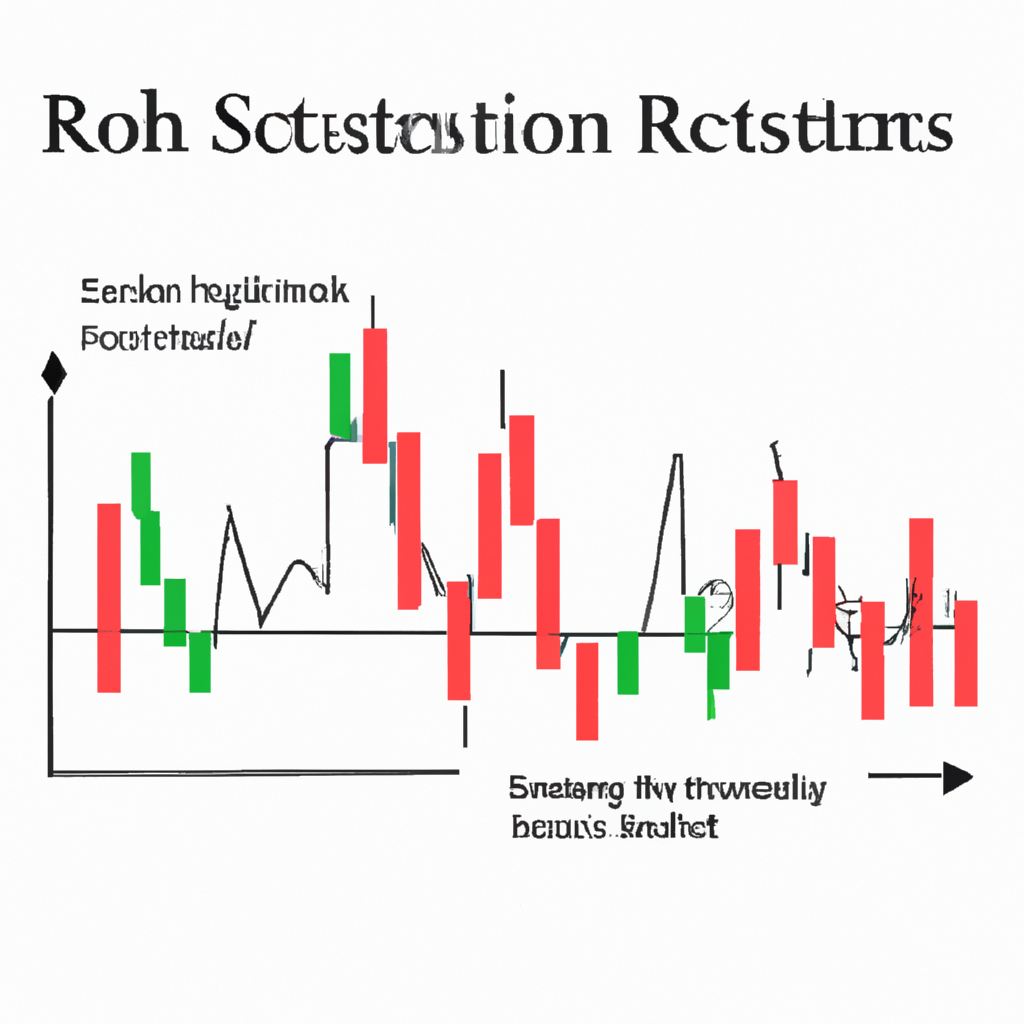
RSI Oscillator Strategies
The Relative Strength Index (RSI) is a popular momentum oscillator that measures the speed and change of price movements. It is used by traders to identify overbought or oversold conditions in the market. Here are some RSI oscillator strategies that traders can use to make informed trading decisions.
1. RSI Overbought and Oversold Levels
One common strategy is to use the RSI to identify overbought and oversold levels in the market. When the RSI is above 70, it is considered overbought, indicating that the price may be due for a correction. Conversely, when the RSI is below 30, it is considered oversold, suggesting that the price may be due for a rebound. Traders can use these levels to enter or exit trades accordingly.
2. RSI Divergence
Another strategy is to look for divergence between the RSI and the price. Divergence occurs when the RSI is moving in the opposite direction of the price. For example, if the price is making higher highs but the RSI is making lower highs, it could signal a potential reversal in the market. Traders can use this divergence to anticipate changes in the price direction.
3. RSI Trendline Breaks
Traders can also use trendlines on the RSI to identify potential trading opportunities. By drawing trendlines connecting the highs and lows of the RSI, traders can look for breaks in these trendlines as signals of a change in momentum. For example, a break above a downward sloping trendline could indicate a bullish reversal, while a break below an upward sloping trendline could signal a bearish reversal.
4. RSI Crosses
RSI crosses are another strategy that traders can use to make trading decisions. When the RSI crosses above the 50 level, it is considered a bullish signal, suggesting that the momentum is shifting to the upside. Conversely, when the RSI crosses below the 50 level, it is considered a bearish signal, indicating that the momentum is shifting to the downside. Traders can use these crosses to enter or exit trades.
Overall, the RSI oscillator is a versatile tool that traders can use to identify potential trading opportunities in the market. By using these strategies, traders can make more informed decisions and improve their chances of success in the market.


