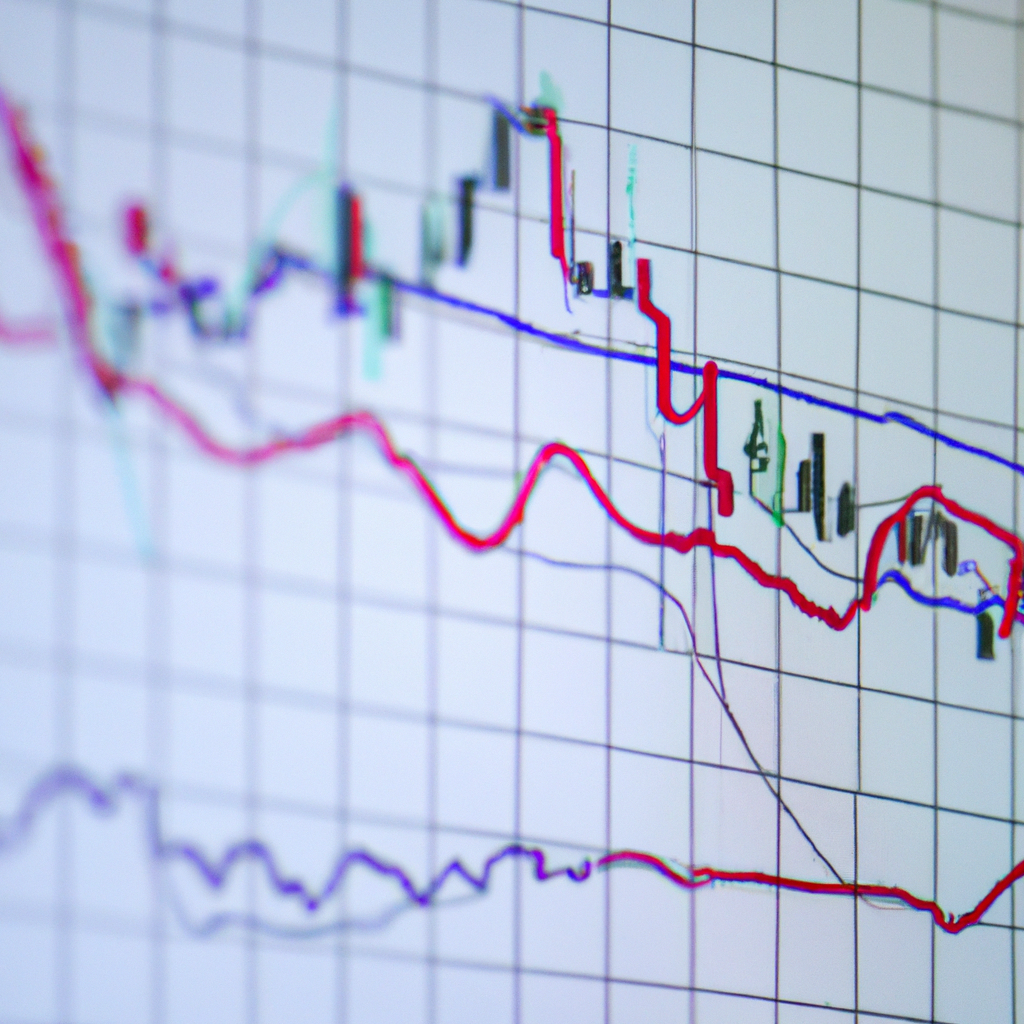
Using Moving Averages for Trend Analysis
What are Moving Averages?
Moving averages are a popular technical analysis tool used by traders and investors to identify trends in a stock or asset’s price movement. A moving average is calculated by taking the average price of an asset over a specific period of time, such as 10 days, 50 days, or 200 days. The moving average smooths out price fluctuations and helps to identify the overall trend of the asset.
Types of Moving Averages
There are two main types of moving averages: simple moving averages (SMA) and exponential moving averages (EMA). SMA gives equal weight to each data point in the calculation, while EMA gives more weight to recent data points. EMA reacts more quickly to price changes compared to SMA, making it more responsive to short-term trends.
How to Use Moving Averages for Trend Analysis
1. Determine the time frame: Decide on the period for the moving average that best suits your trading or investing strategy. Common periods include 50-day, 100-day, and 200-day moving averages.
2. Plot the moving average: Calculate the moving average for the chosen period and plot it on a price chart of the asset. The moving average line will smooth out the price fluctuations and show the overall trend direction.
3. Identify trend signals: When the price of the asset is above the moving average, it indicates an uptrend. Conversely, when the price is below the moving average, it suggests a downtrend. Traders often use crossovers of different moving averages (e.g., 50-day crossing above 200-day) as signals to buy or sell.
4. Confirm trend strength: The slope of the moving average can indicate the strength of the trend. A steeply rising or falling moving average suggests a strong trend, while a flat or sideways moving average indicates a lack of clear direction.
Benefits of Using Moving Averages
– Helps to filter out noise and identify the underlying trend in price movements
– Provides clear buy and sell signals based on crossovers and trend direction
– Can be used in conjunction with other technical indicators for more accurate trend analysis
In conclusion, moving averages are a valuable tool for trend analysis in trading and investing. By understanding how to use moving averages effectively, traders can make informed decisions and improve their chances of success in the market.


