Elliott Wave Analysis Methods
What is Elliott Wave Theory?
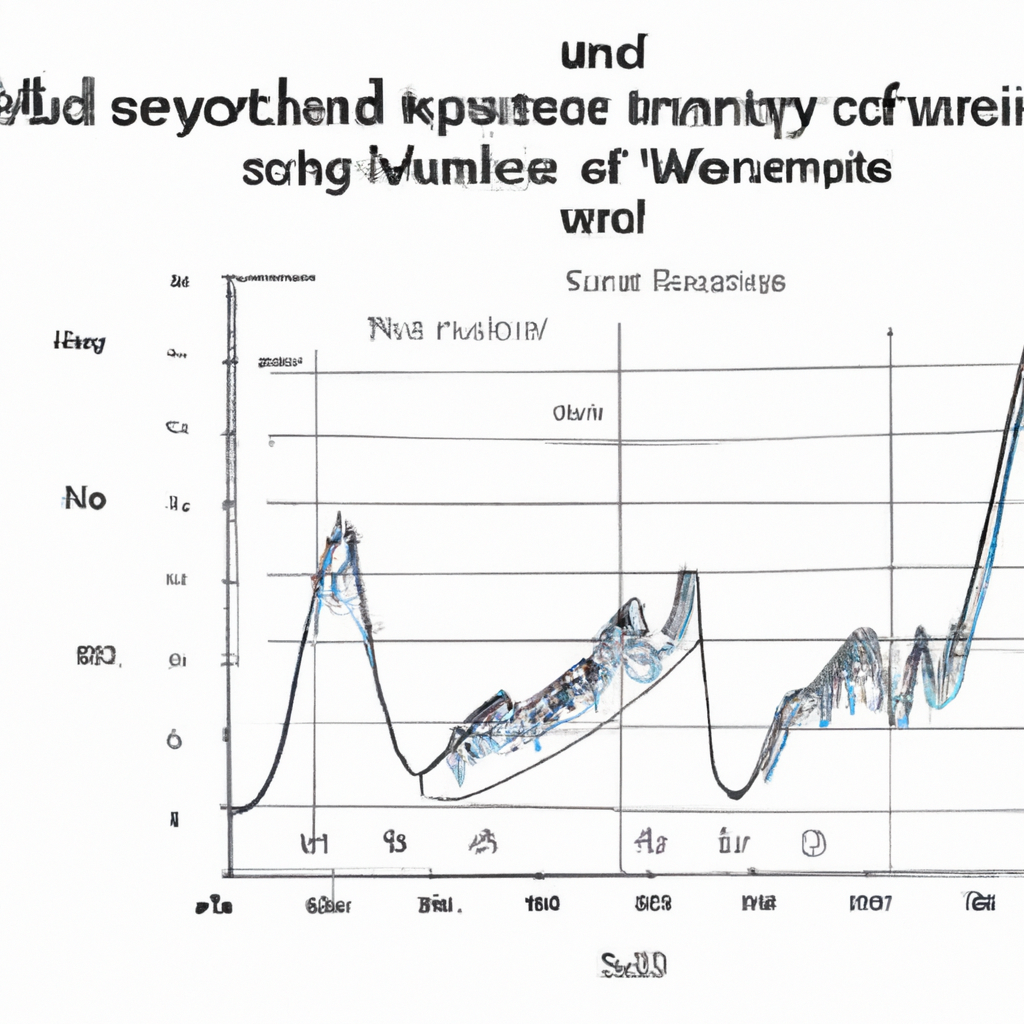
Elliott Wave Theory is a method used in technical analysis that attempts to predict future price movements in financial markets. It is based on the idea that market prices move in repetitive patterns, or waves, that can be identified and analyzed.
Basic Principles of Elliott Wave Theory
1. Impulse Waves
Impulse waves are the main directional movements in price, consisting of five waves in the direction of the larger trend. These waves are labeled 1, 2, 3, 4, and 5.
2. Corrective Waves
Corrective waves are smaller, counter-trend movements that occur in between the larger impulse waves. They are labeled A, B, and C, and typically move in the opposite direction of the larger trend.
How to Use Elliott Wave Analysis
1. Identify the Trend
The first step in using Elliott Wave analysis is to identify the larger trend in the market. This will help you determine whether you are in an impulse wave or a corrective wave.
2. Count the Waves
Once you have identified the trend, you can start counting the waves to determine where you are in the Elliott Wave cycle. Remember that impulse waves consist of five waves, while corrective waves consist of three.
3. Use Fibonacci Ratios
Many Elliott Wave analysts use Fibonacci ratios to help determine price targets and potential reversal points. These ratios can be applied to the length of the waves or the retracement levels of a wave.
Benefits of Elliott Wave Analysis
1. Helps Identify Market Trends
By analyzing wave patterns, Elliott Wave theory can help traders identify the larger trends in the market and make more informed trading decisions.
2. Provides Price Targets
Using Fibonacci ratios and wave counts, Elliott Wave analysis can provide traders with potential price targets for both entry and exit points.
3. Improves Risk Management
By understanding the wave patterns and potential price movements, traders can better manage their risk and set appropriate stop-loss levels.
Conclusion
Elliott Wave analysis is a powerful tool that can help traders predict future price movements and make more informed trading decisions. By understanding the basic principles and using the analysis methods outlined above, traders can gain a competitive edge in the financial markets.


