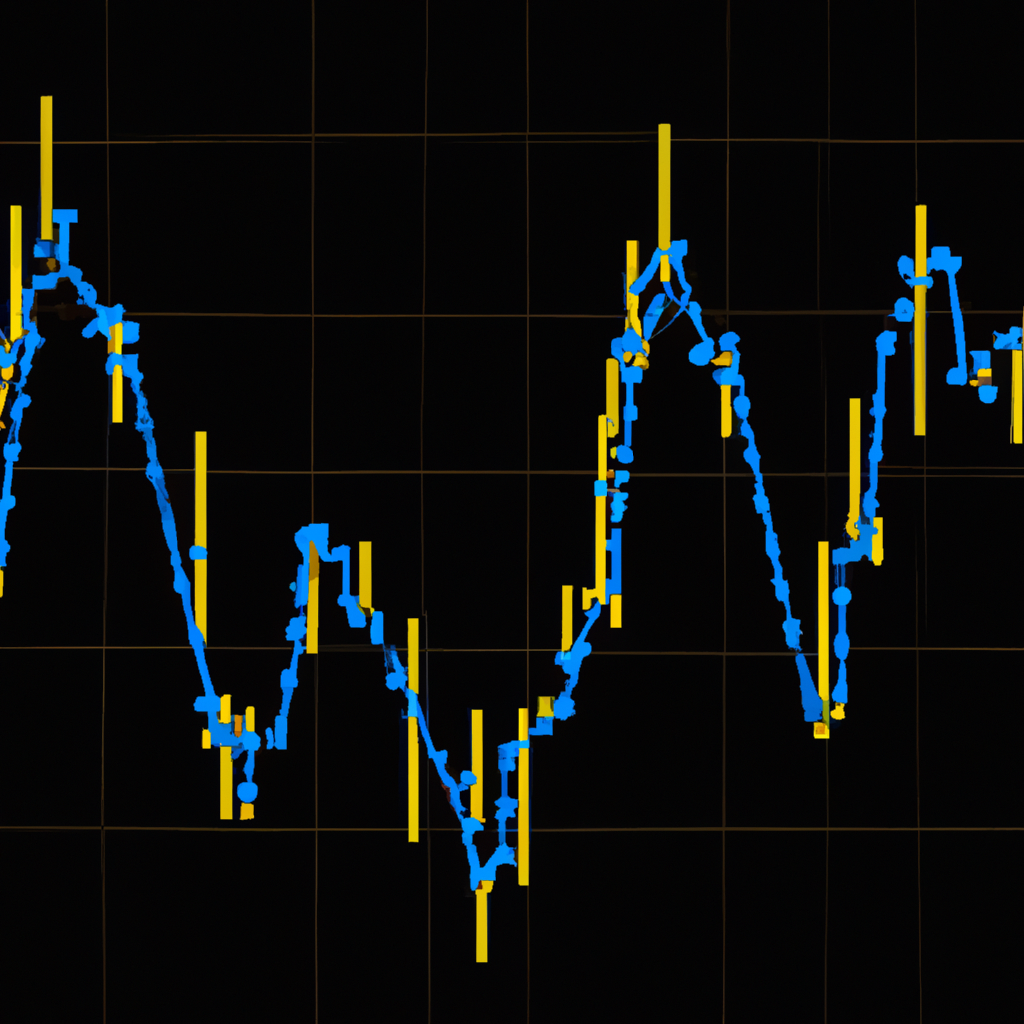
Understanding Linear Regression Channels in Trading
Linear Regression Channels are a technical analysis tool used by traders to identify potential price trends in the financial markets. By plotting a straight line that best fits the price data, traders can determine the direction of the trend and potential support and resistance levels. In this article, we will explore how to use Linear Regression Channels effectively in trading.
What are Linear Regression Channels?
Linear Regression Channels consist of three lines: the upper channel line, the lower channel line, and the median line. The upper channel line is drawn parallel to the median line and represents potential resistance levels. The lower channel line is also parallel to the median line and acts as potential support levels. The median line is the central line that best fits the price data and serves as a reference point for the trend.
How to Use Linear Regression Channels in Trading
Here are some steps to effectively use Linear Regression Channels in your trading strategy:
1. Identify the Trend
Start by plotting the Linear Regression Channel on the price chart. The slope of the channel will help you determine the direction of the trend. If the price is trading above the median line, it indicates an uptrend. Conversely, if the price is trading below the median line, it suggests a downtrend.
2. Identify Support and Resistance Levels
The upper and lower channel lines act as potential support and resistance levels. Traders can look for price bounces or breakouts at these levels to enter or exit trades. The width of the channel can also provide insights into the volatility of the market.
3. Confirm with Other Indicators
While Linear Regression Channels can be a powerful tool on their own, it is essential to confirm the signals with other technical indicators or chart patterns. Combining multiple indicators can help increase the accuracy of your trading decisions.
4. Manage Risk and Set Stop Loss Levels
As with any trading strategy, it is crucial to manage risk and protect your capital. Set stop loss levels based on the support and resistance levels identified by the Linear Regression Channels. This will help you minimize potential losses and preserve your trading account.
Conclusion
Linear Regression Channels can be a valuable tool for traders looking to identify trends and potential price levels in the financial markets. By understanding how to use these channels effectively and combining them with other technical indicators, traders can make more informed trading decisions and improve their overall profitability.


