Utilizing RSI Divergence for Effective Trade Entry
Understanding RSI Divergence for Trade Entry Relative Strength Index (RSI) is a popular momentum oscillator that measures the speed and change of price movements. It is often used by traders…
Advanced Strategies for Trading with the Ichimoku Cloud
Advanced Ichimoku Cloud Strategies Advanced Ichimoku Cloud Strategies Introduction The Ichimoku Cloud is a technical analysis indicator that provides insights into the trend, momentum, and support/resistance levels of a financial…

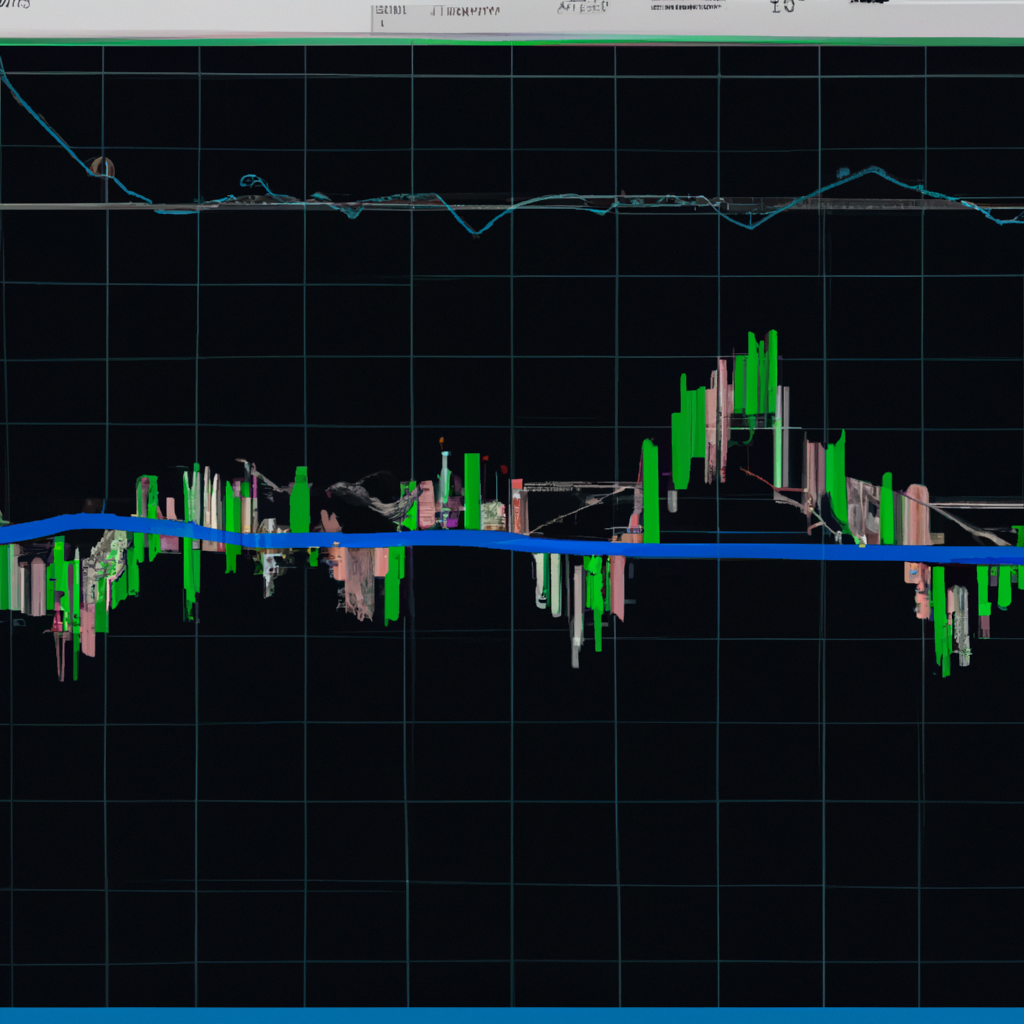
Improving Your Trading Strategy Through Backtesting Trading Indicators
Backtesting Trading Indicators: A Guide to Improving Your Trading Strategy Backtesting trading indicators is a crucial step in improving your trading strategy. By analyzing historical data and testing different indicators,…

Support and Resistance Level Strategies for Successful Trading
Support and Resistance Level Strategies Support and Resistance Level Strategies Understanding Support and Resistance Levels Support and resistance levels are key concepts in technical analysis that help traders identify potential…

Identifying RSI Divergence: A Powerful Tool for Traders
Identifying RSI Divergence Relative Strength Index (RSI) is a popular momentum oscillator that measures the speed and change of price movements. One of the key concepts in using RSI effectively…
Mastering MACD Crossovers: A Guide to Effective Trading
Trading with MACD Crossovers The Moving Average Convergence Divergence (MACD) is a popular technical indicator used by traders to identify trends and potential buy or sell signals in the market.…
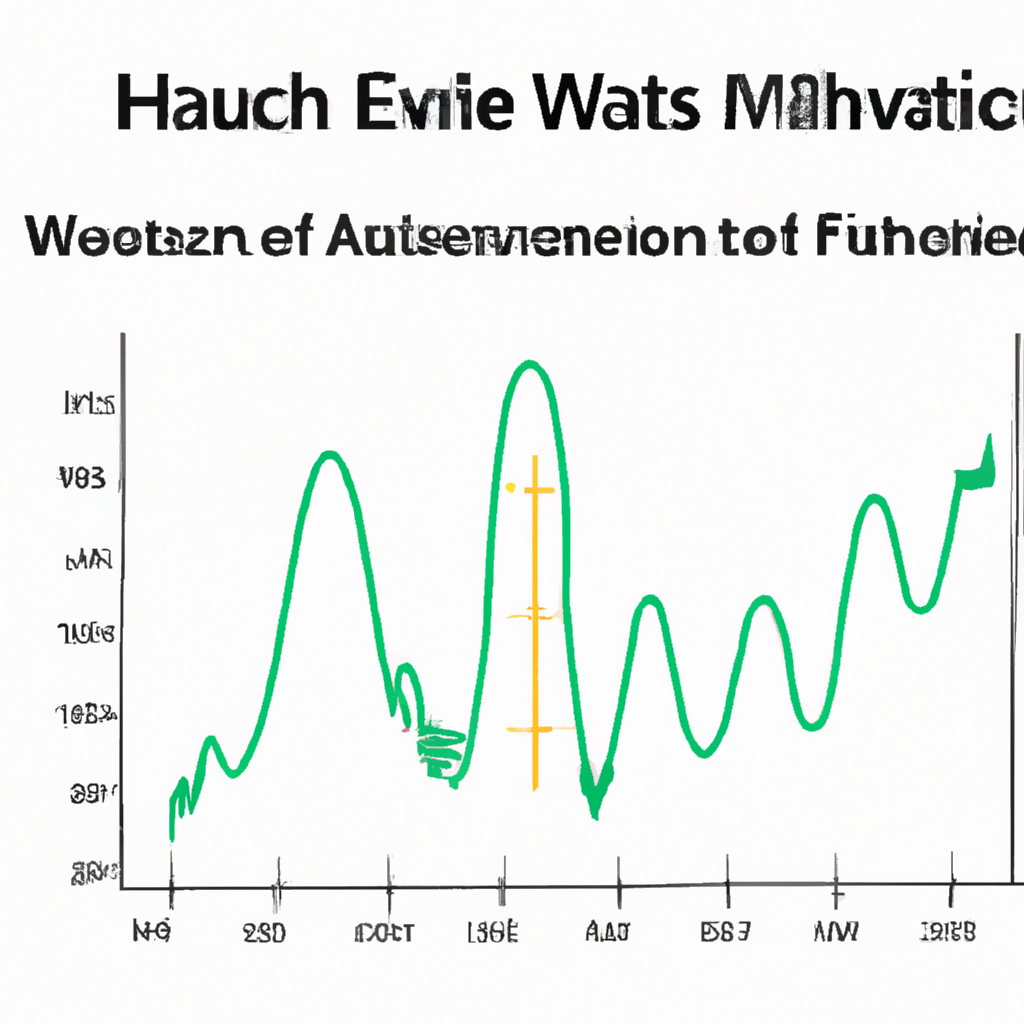
Unlocking the Power of Elliott Wave Analysis: Forecasting Market Trends
Understanding Elliott Wave Analysis Methods Elliott Wave analysis is a method used by traders and investors to forecast market trends based on wave patterns. Developed by Ralph Nelson Elliott in…
Interpreting MACD Histogram for Effective Trading Strategies
Understanding MACD Histogram Interpretations The Moving Average Convergence Divergence (MACD) histogram is a popular technical indicator used by traders to identify potential buy or sell signals in the market. By…
Recognizing Double Tops and Bottoms in Financial Markets
Recognizing Double Tops and Bottoms Recognizing Double Tops and Bottoms What are Double Tops and Bottoms? Double tops and bottoms are reversal patterns that occur in the financial markets. They…

Utilizing Divergence for Effective Trading Strategies
Using Divergence in Trading Strategies When it comes to trading in the financial markets, there are many different strategies that traders can use to try and profit from market movements.…


