
Using Bollinger Bands: A Guide for Effective Trading
Using Bollinger Bands for Trading Bollinger Bands are a popular technical analysis tool used by traders to identify potential price reversals and to determine the strength of a trend. Developed…

The Power of Backtesting: Analyzing Strategies with Historical Data
Backtesting with Historical Data Backtesting is a crucial step in the trading process that involves testing a trading strategy using historical data to see how it would have performed in…

Unlocking the Potential of Fibonacci Extensions in Trading
The Power of Fibonacci Extensions in Trading When it comes to trading, many investors rely on technical analysis to make informed decisions about when to buy or sell assets. One…
Exploring Fibonacci Trading: Understanding Extensions
Understanding Fibonacci Trading with Extensions Fibonacci trading is a popular technical analysis tool used by traders to predict potential price levels in the financial markets. The Fibonacci sequence is a…
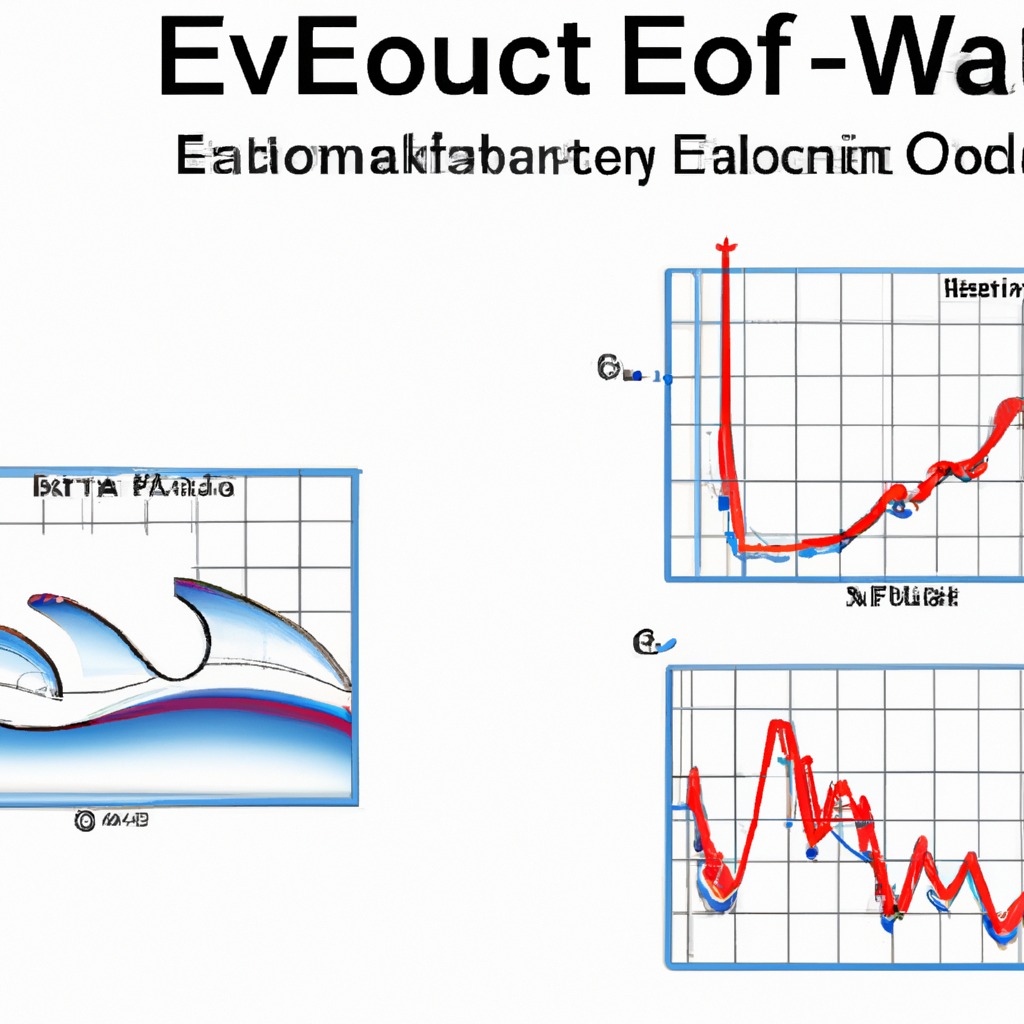
Unlocking the Power of Elliott Wave Forecasting Models
Elliott Wave Forecasting Models: A Comprehensive Guide Elliott Wave Theory is a popular form of technical analysis used by traders and investors to forecast future price movements in financial markets.…

Risk Management Strategies Using Technical Analysis
Risk Management Using Technical Analysis Risk Management Using Technical Analysis Introduction Technical analysis is a method used by traders and investors to forecast the future direction of prices based on…

Trend Line Drawing Methods: Techniques for Technical Analysis
Trend Line Drawing Methods Trend Line Drawing Methods Introduction Trend lines are an essential tool for technical analysis in trading. They help traders identify the direction of a market trend…

Mastering Risk Management in Trading: Essential Strategies for Success
Implementing Risk Management in Trading Implementing Risk Management in Trading Why Risk Management is Important in Trading Risk management is crucial in trading to protect your capital and minimize losses.…
Using RSI to Identify Market Momentum: A Trader’s Guide
Using RSI for Identifying Market Momentum Relative Strength Index (RSI) is a popular technical indicator used by traders to identify overbought or oversold conditions in the market. However, RSI can…

The Dow Theory: A Time-Tested Method for Market Forecasting
Dow Theory in Market Forecasting The Dow Theory in Market Forecasting Introduction The Dow Theory is a time-tested method for analyzing and forecasting market trends. Developed by Charles Dow, the…


