
Mastering Event-Driven Market Analysis
Introduction to Event-Driven Market Analysis Event-driven market analysis combines traditional financial analysis with the study of how various events impact asset prices and financial markets as a whole. This dynamic…
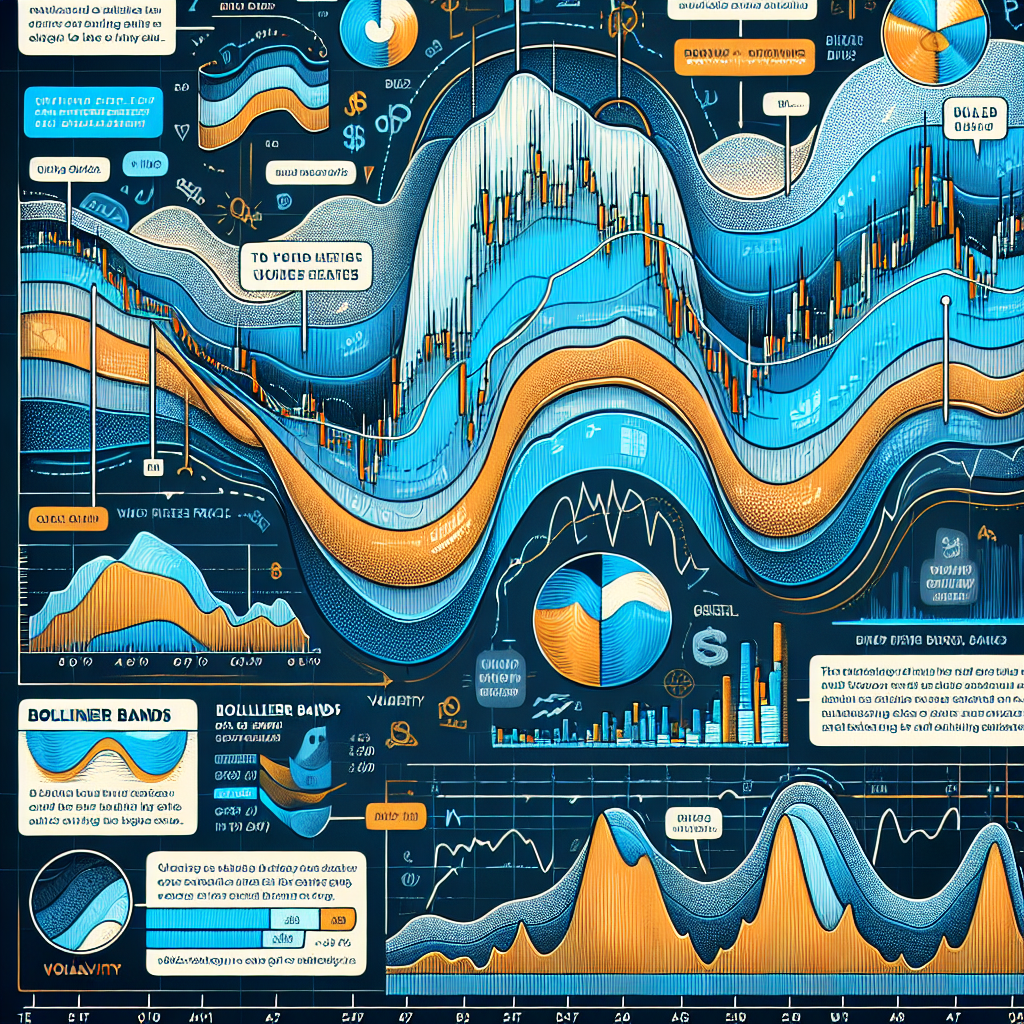
Enhancing Trading Strategies with Bollinger Bands
Mastering Bollinger Bands for Effective Trading Strategies Bollinger Bands are a potent technical analysis tool created by John Bollinger in the 1980s. They are used by traders to measure volatility…

Mastering Backtesting with Historical Data
# Backtesting with Historical Data Backtesting is a critical exercise in the world of finance and trading, allowing traders and investors to test their strategies using historical data before they…

Mastering Fibonacci Extensions in Market Trading
Introduction to Fibonacci Extensions in Trading Fibonacci extensions are a tool that traders use to identify potential levels of support and resistance in the markets. These extensions are based on…
Mastering Pivot Point Trading Strategies
**Pivot Point Trading Strategies** Pivot points are a popular tool among traders for gauging market sentiment and potential areas of support and resistance throughout the trading day. These critical levels…

Unlocking the Power of Fibonacci Extensions in Trading
# Mastering Fibonacci Trading with Extensions In the realm of technical analysis, Fibonacci retracements and extensions are powerful tools utilized by traders to predict possible future levels of support and…

Exploring Elliott Wave Forecasting in Financial Markets
Introduction to Elliott Wave Forecasting Models The Elliott Wave Theory is a method of technical analysis that traders use to forecast trends in the financial markets by identifying extremes in…

Mastering Risk Management with Technical Analysis
Introduction to Risk Management Using Technical Analysis Technical analysis stands as a vital tool in the toolbox of traders and investors, aimed at navigating the often turbulent waters of the…

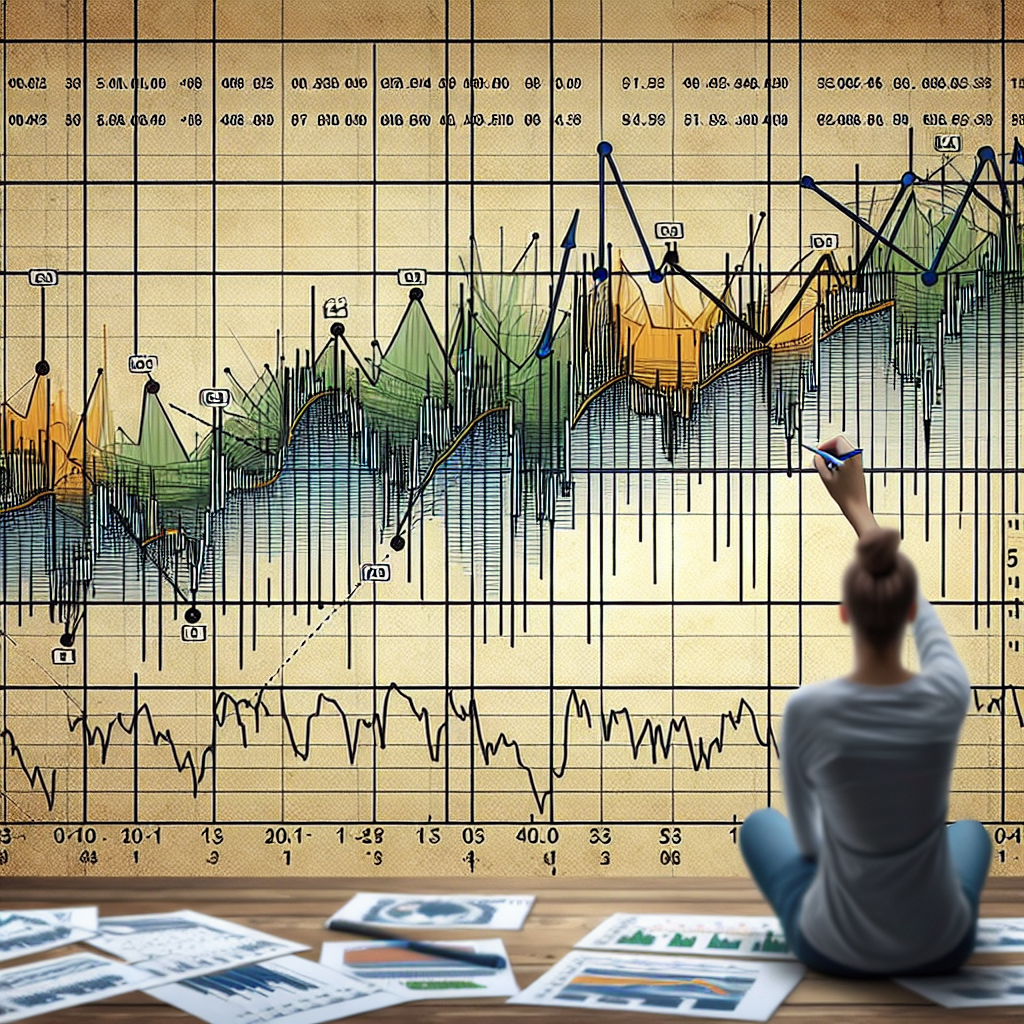
Mastering Trend Line Drawing Techniques in Trading
# Understanding Trend Line Drawing Methods Trend lines are vital tools in technical analysis for both stock and forex markets as they help to illustrate the direction of the market.…

Effective Risk Management Strategies in Trading
Introduction to Risk Management in Trading Risk management is an essential strategy in trading that involves identifying, assessing, and prioritizing risks followed by the coordinated application of resources to minimize,…


