Analyzing Price Gaps: A Guide for Traders
Analyzing Price Gaps in Trading Analyzing Price Gaps in Trading What are Price Gaps? A price gap occurs when there is a noticeable difference between the closing price of an…
Analyzing Volatility Clusters: A Guide for Traders
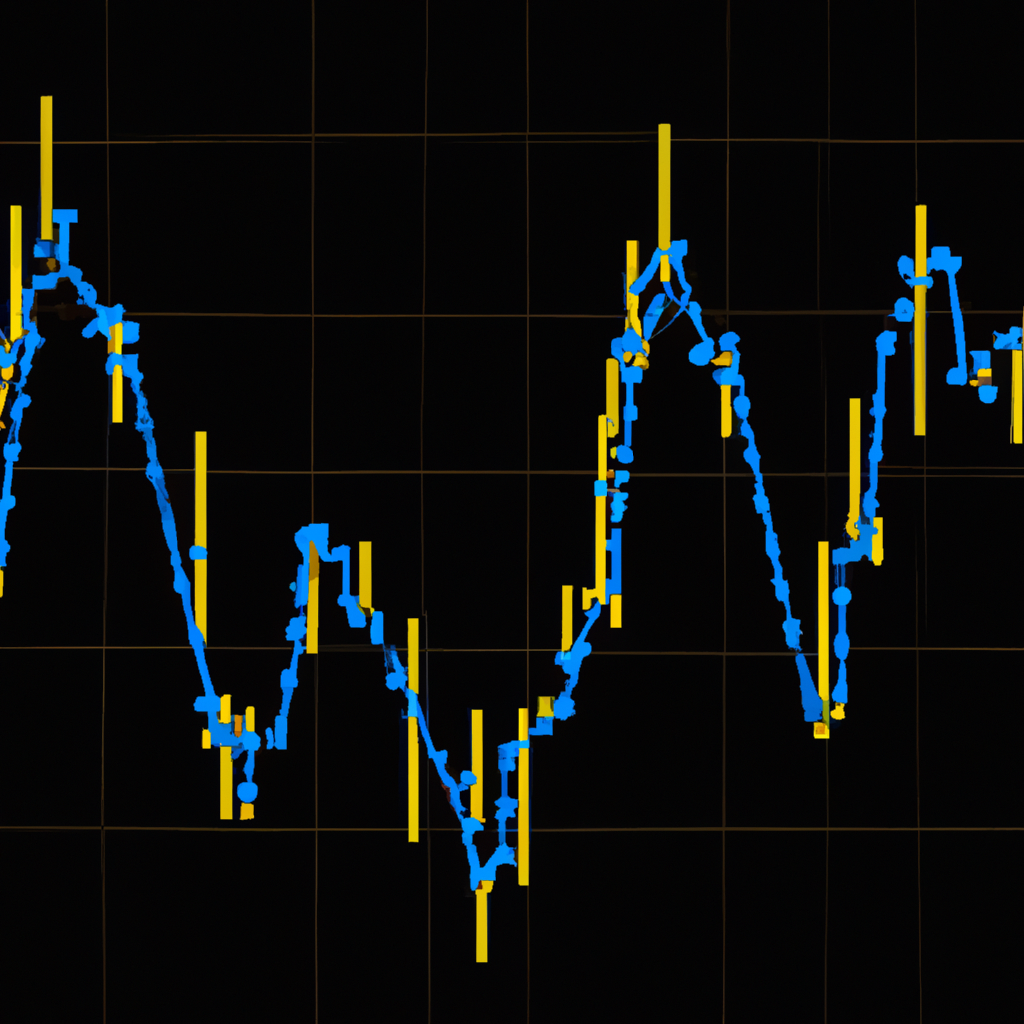
Analysis of Volatility Clusters Volatility clusters are periods of time when the market experiences increased levels of volatility. This can be caused by a variety of factors, such as economic…
Bollinger Squeeze Trading Strategies: Maximizing Profits with Breakouts
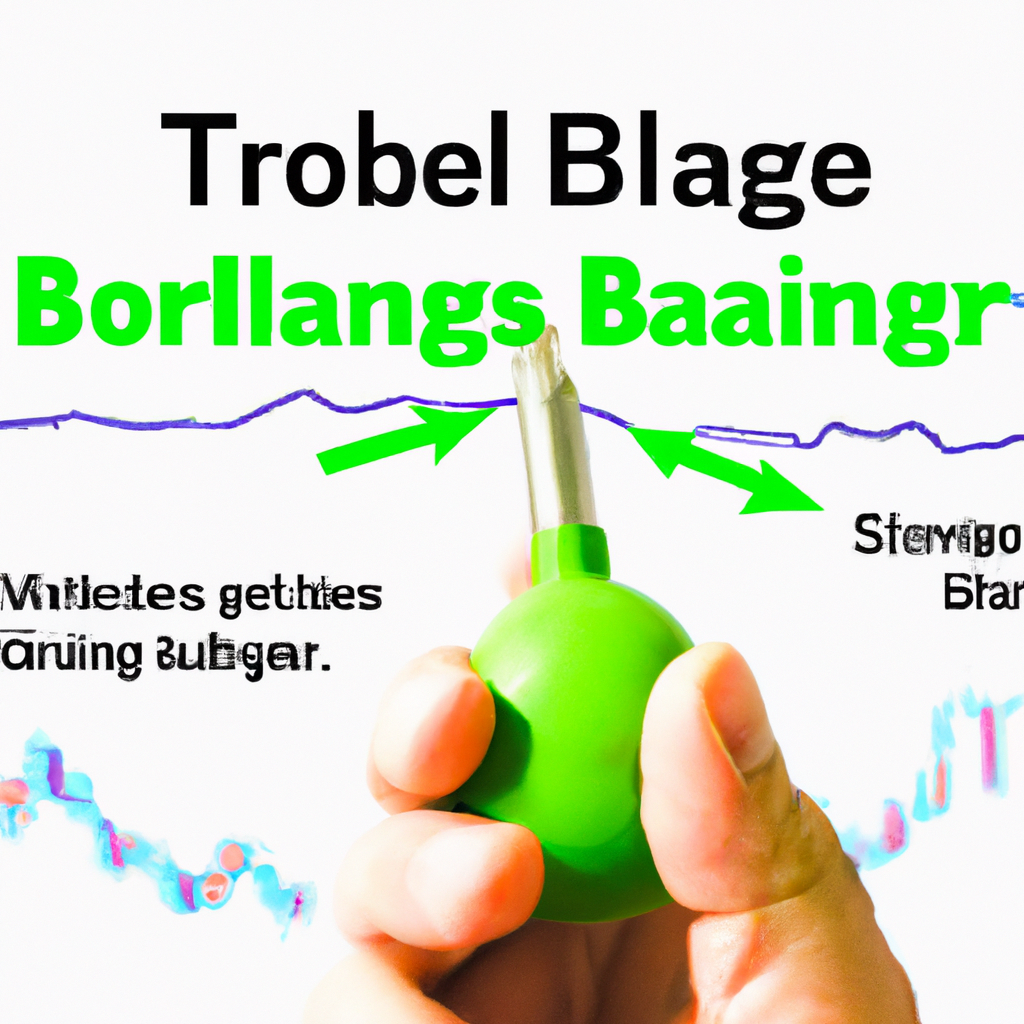
Bollinger Squeeze Trading Strategies Bollinger Squeeze Trading Strategies What is a Bollinger Squeeze? A Bollinger Squeeze occurs when the Bollinger Bands contract tightly around the price action of a stock…
Effective Risk Management with Technical Indicators
Risk Management with Technical Indicators When it comes to trading in the financial markets, risk management is crucial for protecting your capital and ensuring long-term success. One way to manage…
Unlocking Trading Opportunities with Relative Rotation Graphs (RRG)
Understanding Relative Rotation Graphs (RRG) Relative Rotation Graphs (RRG) are a powerful tool used in technical analysis to visualize the relative strength and momentum of various assets in a single…
Effective Price Projection Techniques for Traders and Investors
Price Projection Techniques Price Projection Techniques Introduction Price projection techniques are used by traders and investors to forecast the future price movement of a financial instrument, such as a stock,…
Unlocking the Power of Multi-Timeframe Analysis in Trading
Understanding Multi-Timeframe Analysis Techniques Multi-timeframe analysis is a popular trading strategy used by traders to gain a comprehensive view of the market. By analyzing price movements across different timeframes, traders…
Exploring Linear Regression Channels in Trading: A Technical Analysis Tool
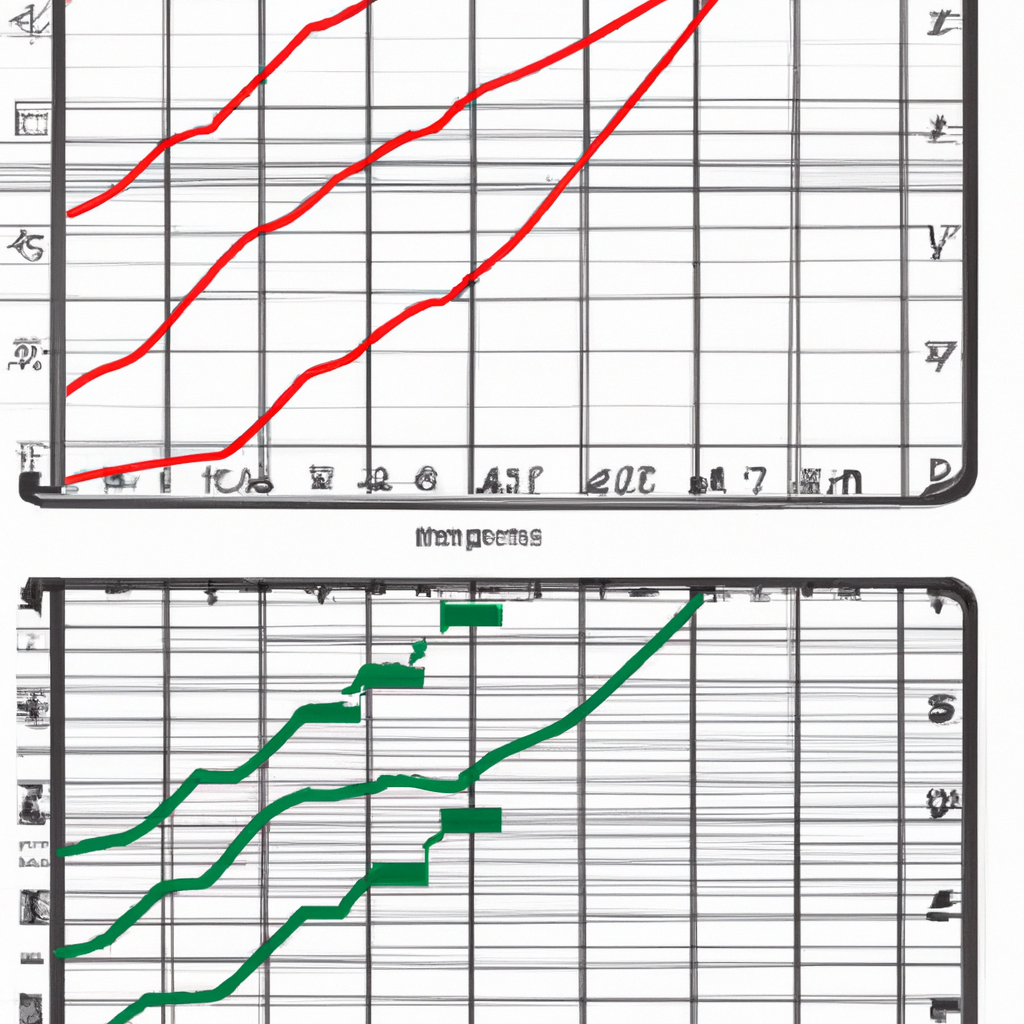
Understanding Linear Regression Channels in Trading Linear Regression Channels are a technical analysis tool used by traders to identify potential price trends in the financial markets. By plotting a straight…
Exploring Point and Figure Chart Techniques for Market Analysis
Understanding Point and Figure Chart Techniques Introduction Point and figure charts are a type of technical analysis tool used by traders to identify potential trends in the market. This charting…
Price Patterns in Technical Analysis: A Guide for Traders
Price Patterns in Technical Analysis Introduction Technical analysis is a method used by traders to forecast future price movements based on historical data. One key aspect of technical analysis is…


