
Mastering Market Timing with Oscillators: A Comprehensive Guide
# Applying Oscillators in Market Timing Traders and investors often look for tools and techniques to make more informed decisions about when to buy or sell assets. Technical analysis offers…

Mastering Ichimoku Cloud Trading Signals for Success
# Unlocking the Secrets of Ichimoku Cloud Trading Signals The Ichimoku Cloud, or Ichimoku Kinko Hyo, is a comprehensive indicator that defines support and resistance, identifies trend direction, gauges momentum,…

Mastering Momentum Trading with Oscillators Guide
Introduction to Momentum Trading with Oscillators Momentum trading is a strategy used by traders to buy or sell assets according to the strength of recent price trends. This technique hinges…

Mastering Algorithmic Trading with Technical Indicators
# Algorithmic Trading with Technical Indicators Algorithmic trading has transformed the landscape of the financial markets, enabling high-speed, strategic trading decisions that can maximize profits and minimize losses. Technical indicators…
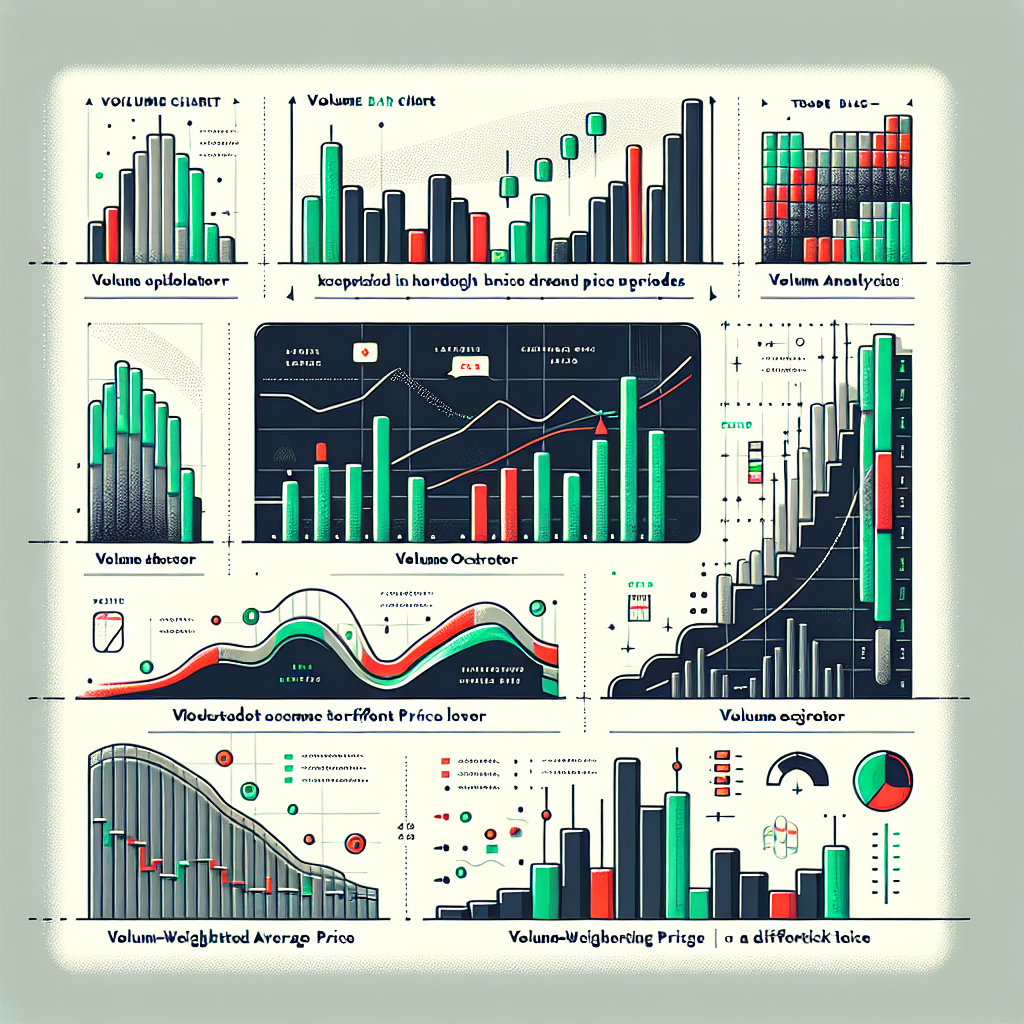
Mastering Volume Analysis in Stock Trading
# Volume Analysis Techniques Analyzing trading volume is a critical aspect for anyone involved in the stock market, as it provides insight into the strength or weakness of a price…

Mastering Algorithmic Trading Strategies in Technical Analysis
Introduction to Algorithmic Strategies in Technical Analysis Algorithmic trading strategies have gained prominence in the financial markets, leveraging computer algorithms to trade securities based on predefined criteria. These strategies are…
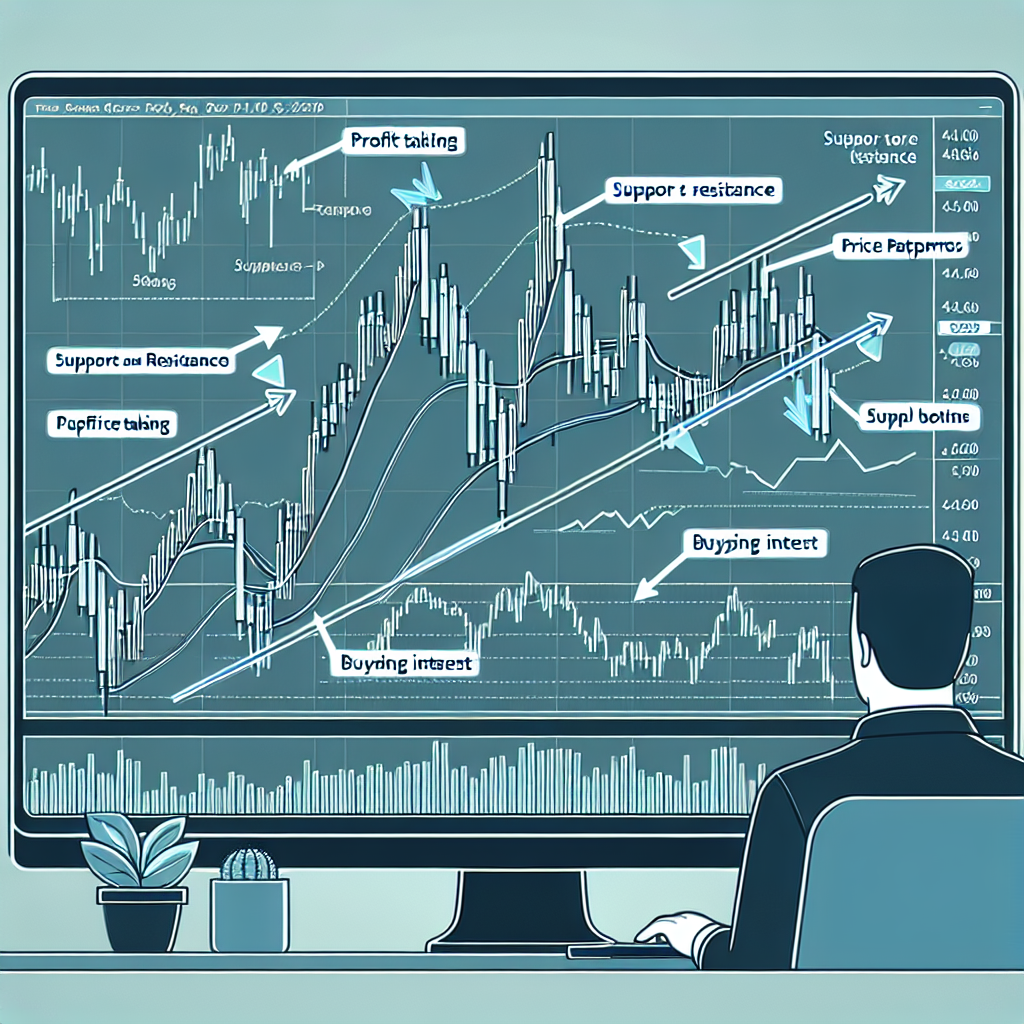
Exploring Support and Resistance Trading Tactics
Support/Resistance Trading Strategies Support/Resistance Trading Strategies Understanding support and resistance levels is a fundamental aspect of trading strategies in the financial markets. These concepts serve as the cornerstone on which…

Mastering Harmonic Patterns in Trading Strategies
# The Role of Harmonic Patterns in Trading Trading involves a multitude of strategies and tools that help investors make educated decisions. Among these, harmonic patterns stand out for their…
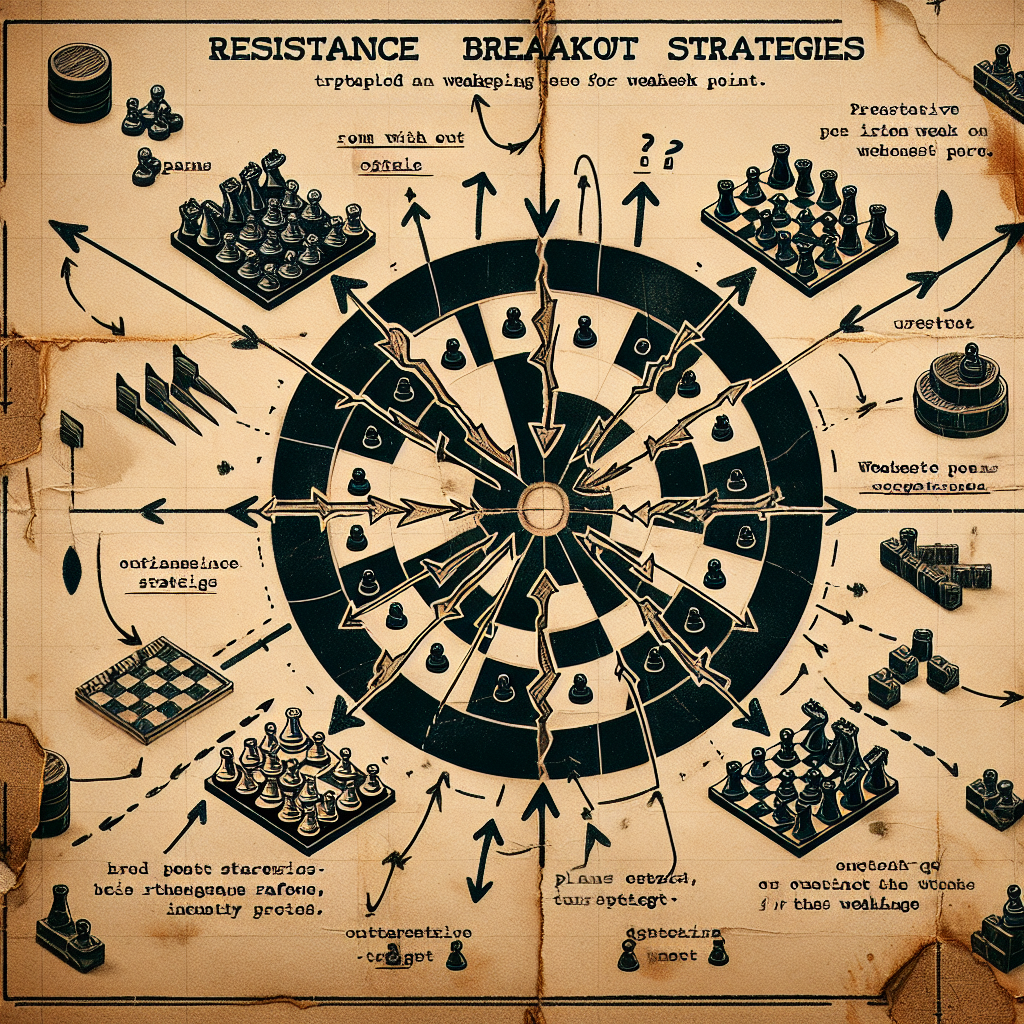
Unlocking the Potential of Resistance Breakout Strategies
# Mastering Resistance Breakout Strategies When trading in financial markets, identifying the right moment to enter or exit a position is crucial for success. Resistance breakout strategies are among the…

Applying Dow Theory in Modern Financial Markets
# Applying Dow Theory to Modern Markets The Dow Theory, formulated by Charles H. Dow, co-founder of Dow Jones & Company, is one of the oldest theories used in technical…


