Elliott Wave Theory Application
Introduction
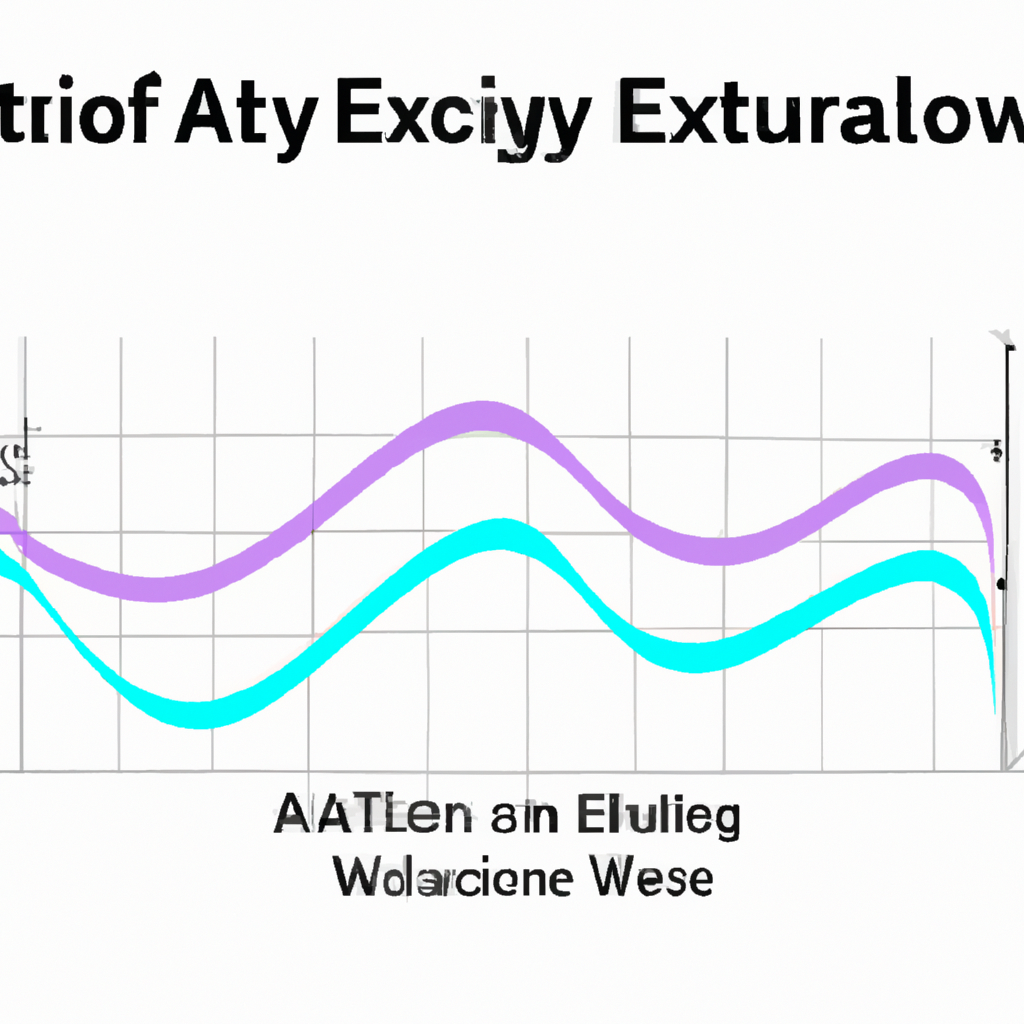
Elliott Wave Theory is a technical analysis approach that attempts to predict future price movements based on crowd psychology and market sentiment. Developed by Ralph Nelson Elliott in the 1930s, this theory suggests that market prices move in repetitive patterns or waves, which can be used to forecast future price movements.
Understanding Elliott Waves
According to Elliott Wave Theory, market prices move in five waves in the direction of the main trend, followed by three corrective waves. These waves are labeled as impulse waves (1, 2, 3, 4, 5) and corrective waves (A, B, C). Traders can use these wave patterns to identify potential entry and exit points in the market.
Applying Elliott Wave Theory
Step 1: Identify the Trend
The first step in applying Elliott Wave Theory is to identify the current trend in the market. This can be done by analyzing price charts and looking for patterns that indicate the direction of the market.
Step 2: Count the Waves
Once the trend is identified, traders can start counting the waves according to the Elliott Wave Theory. This involves looking for five impulse waves in the direction of the trend, followed by three corrective waves.
Step 3: Determine Entry and Exit Points
After counting the waves, traders can use this information to determine potential entry and exit points in the market. For example, entering a trade at the start of an impulse wave and exiting at the end of the corrective wave can be a profitable strategy.
Step 4: Set Stop Loss and Take Profit Levels
It is important to set stop loss and take profit levels when trading based on Elliott Wave Theory. This helps to manage risk and protect profits in case the market moves against the predicted wave pattern.
Conclusion
Elliott Wave Theory can be a powerful tool for traders looking to forecast market movements and make informed trading decisions. By understanding the wave patterns and applying them to price charts, traders can improve their trading strategies and increase their chances of success in the market.


